Database
Over the past 10 years, CAGE has led 68 multidisciplinary expeditions for both research and education. In total, CAGE has covered 88,500 nmi (164,000 Km) in approximately 19,500 hours. A complete overview of CAGE cruise activities is available on CAGE’s interactive geodata web map. The map is open for all, and anybody can visualize or download descriptive metadata. The cruise reports, in addition to the research data (if deposited in Open Data Repositories) from associated cruises are accessible to all through the links on the website.
How to use the geodata website
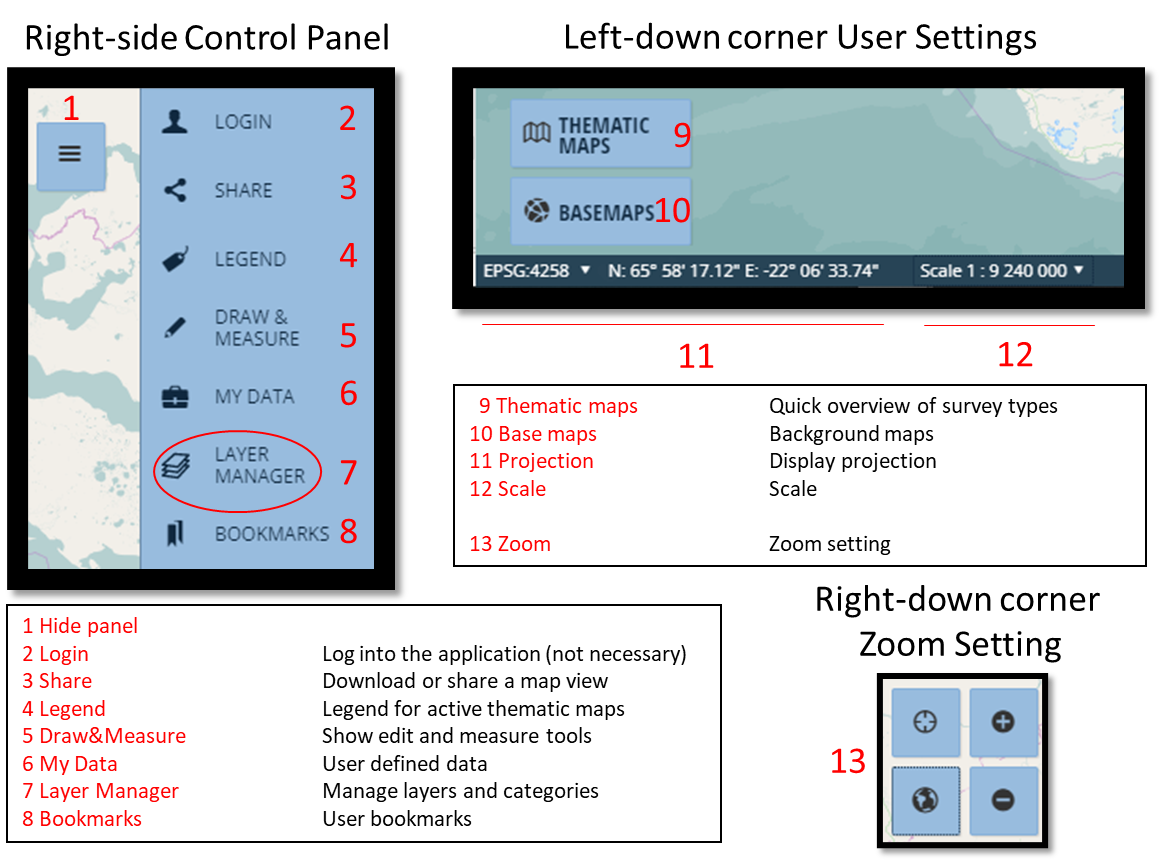
The geodata map is intuitive and interactive, working with clickable objects. It consists of 19 layers for each type of survey (i.e., CTD, Multibeam, etc) and each of these contains sub-layers with the collection years and associated research expeditions.
Below is some information and tips to help guide you through the layers and features on the geodata website.

Metadata visualization
- Open the Layer manager (7) on the right-side Control Panel.
- Tick and plot the layer (or sub-layer) of your interest.
- Click on the object/group of objects of your interest.
- In the list of results (hits) click on the object of your interest to read metadata.
Metadata download
- Open the Layer manager (7) on the right-side Control Panel.
- Tick and plot the layer (or sub-layer) of your interest.
- Open the table view by clicking the symbol
 .
. - Select your favourite metadata format using
 (it is above the table headers).
Contact
If you need to contact the Primary Investigators or Chief Scientist for scientific questions, you will find their email addresses in the first layer (Ship Tracks) of the map. The Ship Tracks layer also provides general information about the research cruise.
For any other need, please contact the Department of Geosciences at The Arctic University of Norway (UiT), currently curator of CAGE’s Legacy. These are website and email
